A solar plant can generate substantial electricity and still perform below expectations. What matters next is understanding what’s behind that performance gap.
Was the solar resource lower than expected? Did equipment limit output? Did grid downtime reduce generation? Or did operating losses affect performance?
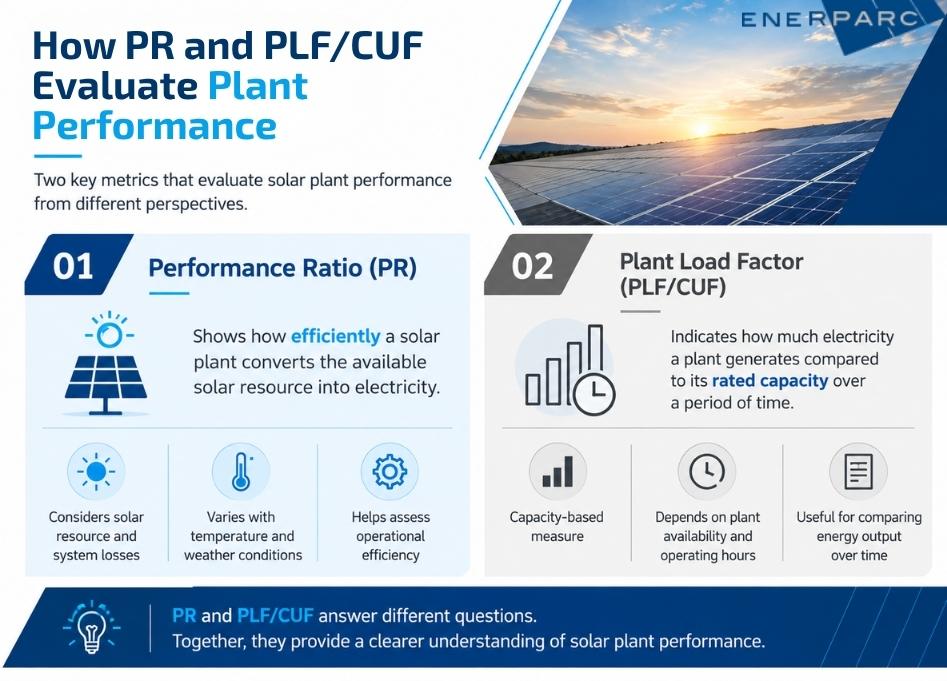
Two metrics help answer these questions: Performance Ratio and Plant Load Factor of a solar power plant. PR shows how effectively a PV system converts available solar resource into electricity. PLF measures generation against the plant’s rated capacity over a defined period.
Neither metric tells the full story on its own. The useful benchmark depends on the project’s location, design, technology, solar resource, and operating conditions.
What Do PR and PLF/CUF Measure in a Solar Plant?
What is solar plant Performance Ratio (PR)?
The performance ratio of a solar power plant compares actual plant output with the solar resource available to the PV system. It uses AC system yield and plane-of-array irradiation. This measures the solar energy received by panels in their actual orientation.
PR can also change with temperature. The PV Performance Modelling Collaborative notes that PR can be lower in warmer periods. It can be higher in colder periods.
What is solar PLF or CUF?
CUF measures the electricity a plant generates against its rated capacity over a given period. CERC uses CUF for solar PV projects in its Renewable Energy Tariff Regulations, 2024.
PLF and CUF are related capacity-based metrics, but CERC uses CUF for solar PV projects. Under CERC’s 2024 regulations, 8,766 hours are used for annual CUF and PLF calculations.
What Are Realistic PR and Solar Plant Load Factor (PLF) Benchmarks in India?
There’s no single number that defines a well-performing solar plant across India. Solar generation benchmarks in India depend on the project type and location. Solar resource, design, and operating conditions also affect performance.
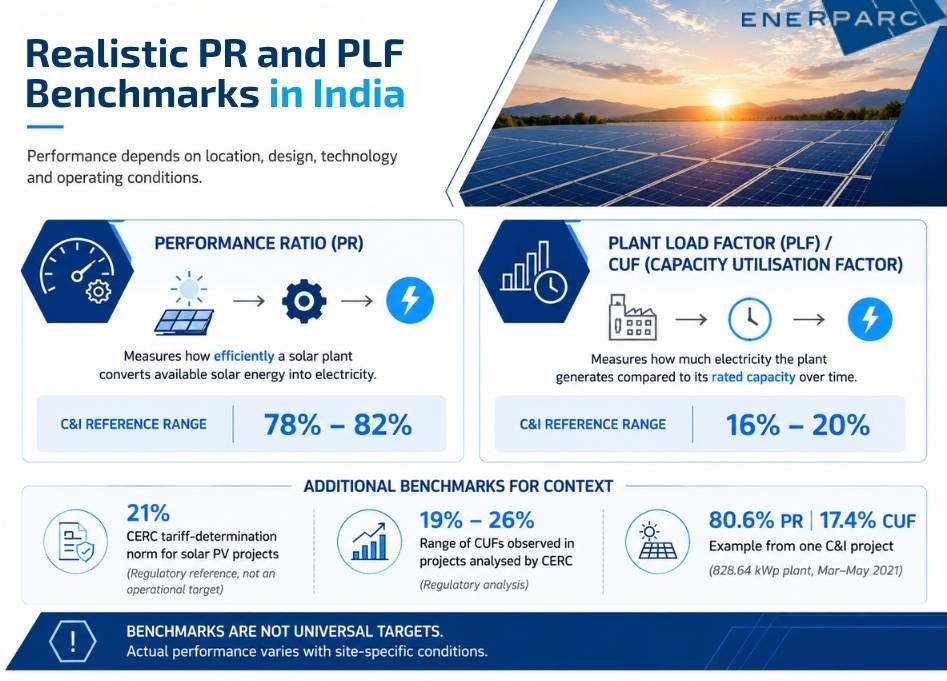
For C&I projects, our internal experience indicates the following ranges:
| Metric | C&I Reference |
| Performance Ratio | About 78–82% |
| CUF | About 16–20% |
CERC’s Renewable Energy Tariff Regulations, 2024 specify a 21% minimum CUF for solar PV projects when setting project-specific tariffs. This is a regulatory tariff benchmark. It is not a universal operating target for every C&I solar plant.
CERC’s explanatory memorandum also notes that the projects it analysed had CUFs ranging from 19% to 26%.
An India-specific C&I example reported by IEEFA recorded 17.4% CUF and 80.6% PR for an 828.64 kWp plant. The performance assessment covered March to May 2021, so this should be treated as a project example rather than a national benchmark.
Why Can Two Solar Plants Have Different PR or CUF?
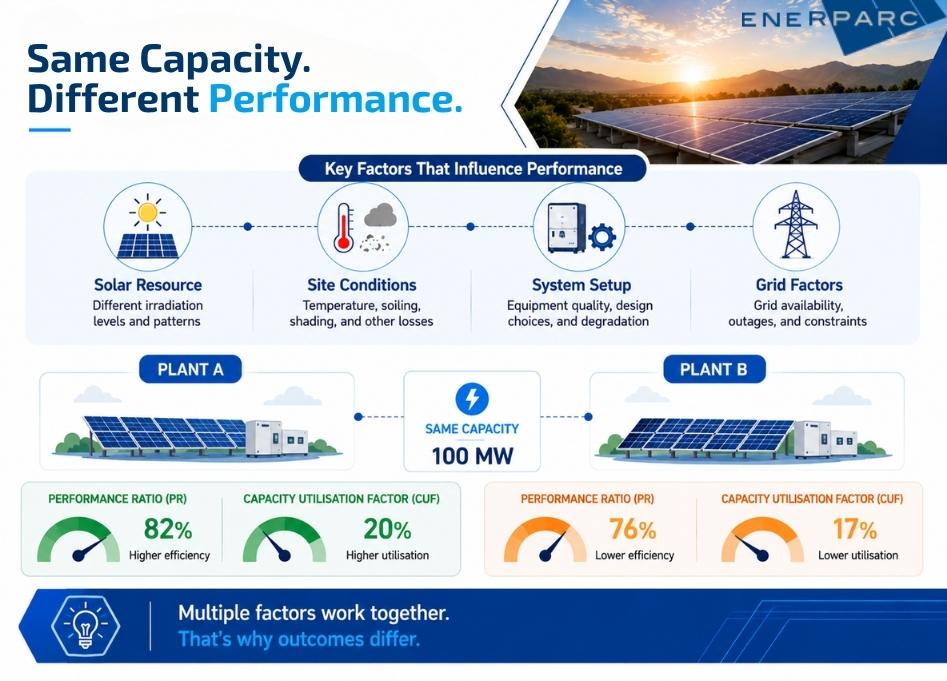
Two plants with the same installed capacity can perform differently because their site and operating conditions vary.
- Location and solar irradiation: Solar irradiation varies by location and season. Plane-of-array irradiation also depends on the PV array’s position and the solar conditions at the site.
As a result, two plants can’t always be judged fairly against the same generation expectation. PR and solar Plant Load Factor (PLF) benchmarks in India also depend on site conditions.
- Temperature, soiling, and shading: Higher module temperatures can reduce PV output and affect PR. Soiling can reduce sunlight reaching the modules. Shading can also cause generation losses.
- System design and equipment: System design and equipment behaviour also affect plant performance. Inverter limits, equipment downtime, and component degradation can reduce generation. This can happen even when solar conditions remain favourable.
- Grid availability: Grid outages can reduce exported generation. Common causes of underperformance include soiling, equipment downtime, and grid outages. Shading, inverter clipping or derating, and module degradation can also reduce performance.
Why Should PR and CUF Not Be Judged Alone?
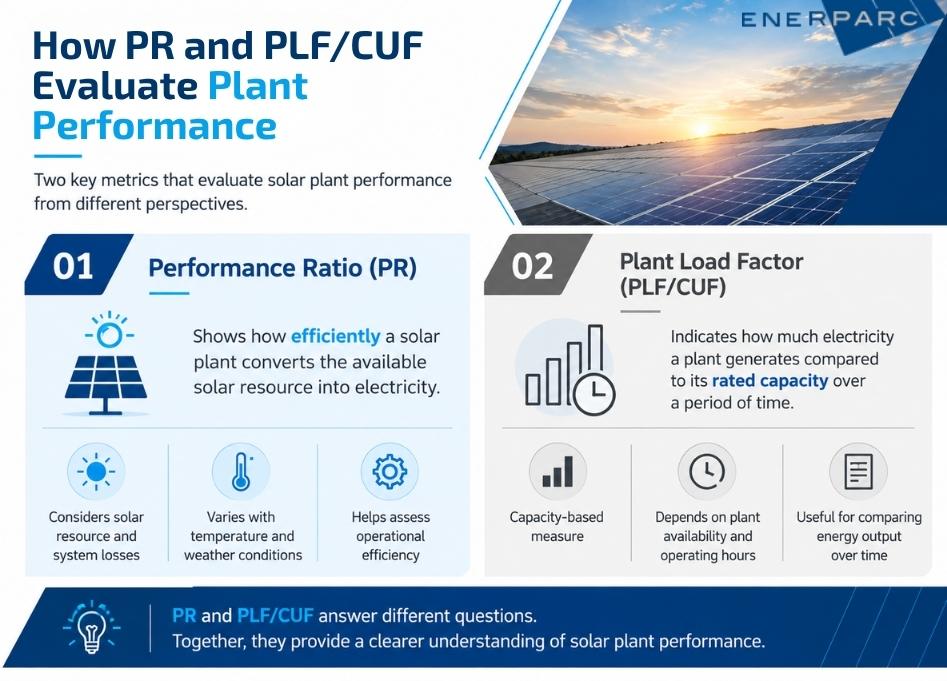
A PR or CUF figure can look reasonable while a plant still misses its expected generation. A better assessment compares plant output with the solar resource available during that period.
As Harish Kumar, AGM at Enerparc, explains, “PR or CUF shouldn’t be viewed as standalone KPIs. Performance should be assessed against irradiation and expected generation.”
This changes the question from “Is the solar capacity utilisation factor good?” to “Did the plant generate what its conditions and design indicated?”
A lower CUF during weaker irradiation doesn’t automatically indicate an operational problem. Compare actual generation with expected generation, irradiation, availability, and recorded losses. Do not rely only on PR and solar Plant Load Factor (PLF) benchmarks in India.
What Causes a Solar Plant to Miss Its Expected Performance?
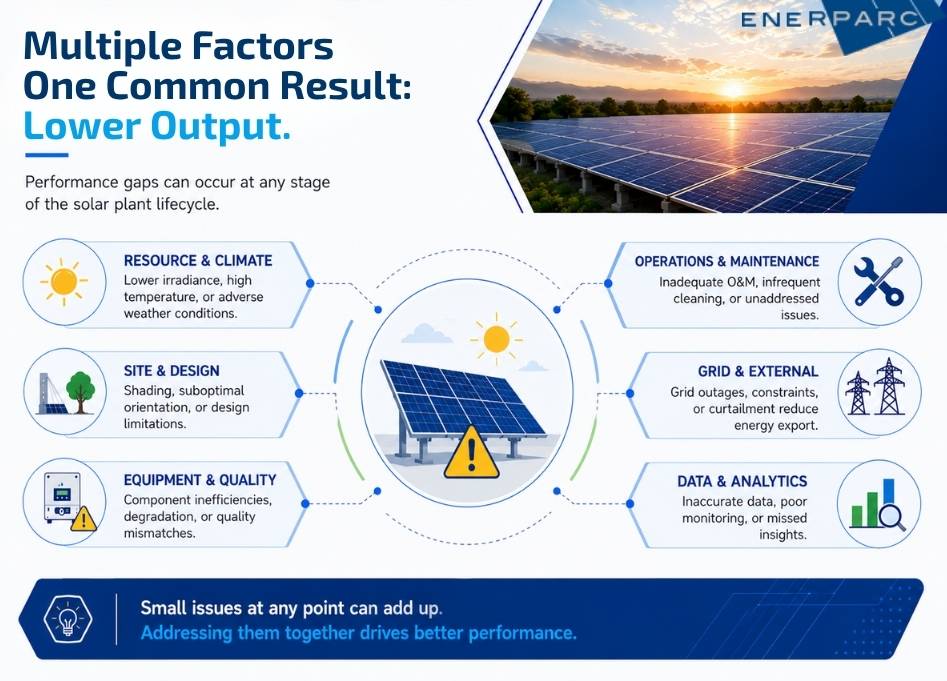
Performance losses can come from several sources, and their impact varies by project. Identifying these factors is an important part of solar asset performance benchmarking.
Common causes include:
(i) Soiling on modules
(ii) Equipment downtime
(iii) Grid outages
(iv) Shading
(v) Inverter clipping or derating
(vi) Module degradation
The right corrective action depends on the loss category. Cleaning addresses soiling, while equipment faults require a different investigation.
In practice, unusual generation changes can reveal equipment or operational losses early. This can help prevent recurring generation gaps.
How Should You Track Solar Plant Performance?
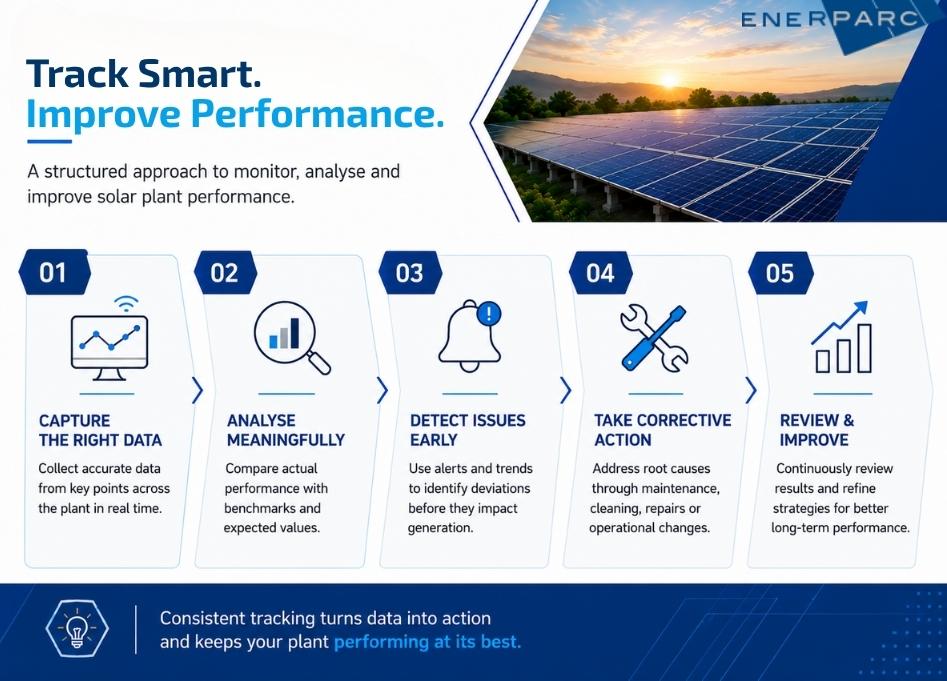
A useful performance dashboard should look beyond PR and CUF. A useful dashboard should track irradiation, expected generation, actual generation, and availability. It should also track equipment alarms and identified loss categories.
IEC 61724-1:2021 defines terms, equipment, and methods for monitoring PV system performance.
Effective O&M can include real-time monitoring and automated alerts. It can also include preventive maintenance, optimised module cleaning, and annual thermography. Site-level root-cause solar plant performance analysis can help identify issues.
This approach helps move performance management beyond recording numbers. It also helps identify why generation changes and where corrective action may be needed.
What Should Be Considered a Good Benchmark for Your Solar Plant?

Instead of asking whether a plant meets a generic solar plant performance ratio benchmark in India or a CUF number, ask these five questions:
- What solar irradiation did the plant receive?
- What generation did the design predict?
- What generation did the plant actually deliver?
- Which losses explain the difference?
- Is performance stable across seasons and operating periods?
This gives you a stronger basis for assessing plant health and identifying performance gaps.
Are You Benchmarking Your Solar Plant Against the Right Numbers?
A benchmark is useful only when it reflects the conditions behind the number.
PR and CUF can help identify performance trends, but neither should become a standalone pass-or-fail measure. Project conditions, design choices, operating losses, and resource availability all shape the result
For C&I solar projects, being within an industry range doesn’t guarantee good performance. The plant should also be assessed against its expected generation under actual operating conditions. Relevant PR and solar Plant Load Factor (PLF) benchmarks in India should also be considered.
Frequently Asked Questions (FAQs)
1. What is the difference between CUF and PLF?
CUF and PLF both compare a plant’s actual generation with its rated capacity over a given period. For solar PV projects in India, CERC uses CUF as the relevant term. PLF is used more broadly across power generation.
2. What is a good solar capacity factor?
There’s no single solar capacity factor in India that suits every solar plant. For C&I projects, 16–20% is a good range. Your plant’s location and irradiation can affect the expected result. System design, technology, grid availability, and operating conditions can also affect performance.
3. What is a good Performance Ratio for solar?
For C&I projects, a 78–82% Performance Ratio of a solar system is a good range. However, you should read PR alongside irradiation and expected generation. Temperature and other system losses can also change the measured value.
4. How do irradiance and temperature affect photovoltaic performance?
Irradiance determines how much solar energy reaches your PV system. It directly affects potential generation. Higher module temperatures can reduce electrical output and lower PR. This is why the same plant can perform differently across seasons and operating conditions.
5. Can on-grid solar panels work during a power outage?
A standard grid-connected solar system disconnects when the grid goes down. This prevents the system from feeding electricity into a grid that may be under repair. Solar panels alone can’t provide backup power during an outage. You need suitable additional equipment.